Source: Al Bartlett [1]
It’s the small percentage points of constant growth that trigger geometric explosions, and decree death by geometric progression. The masters of the world, the two thousand people who are in charge of the entire economy of the Earth know this perfectly well, and for this reason they have already planned, since 2000, to cut and decimate the useless “Resource Eaters”, the rest of the world’s population.
Prof. Bartlett explains in a simple and understandable way the numbers that condemn us with no way out to genocide. There is no appeal, there are no alternative ways out. The COVID Rocky Horror Show, along with the forced inoculations of toxic and deadly gene treatments, are the “Final Solution” to the “Geometric Progression Question”.
* * * * * *
It’s a real pleasure to be here, and to have a chance just to meet with you, and talk about some of the problems that we’re facing. Some of these problems are local, some are national, some are global, but they’re all tied together. They’re tied together with arithmetic, and the arithmetic isn’t very difficult, and what I hope to do is I hope to be able to convince you that the greatest shortcoming of the human race is our inability to understand the exponential function.

What’s the exponential function? This is a mathematical function that you would write down if you’re going to describe the size of anything that was growing steadily. If you had something growing 5% per year, you’d write the exponential function to show how large that growing quantity was year after year. We’re talking about a situation where the time that’s required for the growing quantity to increase by a fixed fraction is a constant, 5% per year. The 5% is a fixed fraction, the per year is a fixed length of time. That’s what we want to talk about, its ordinary steady growth.
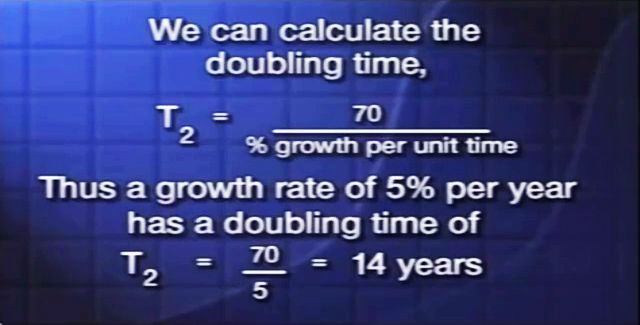
If it takes a fixed length of time to grow 5%, it follows it takes a longer fixed length of time to grow 100%. That longer time’s called the doubling time. We need to know how you calculate the doubling time, and it’s easy. You just take the number 70, divide it by the percent growth per unit time, and that gives you the doubling time. So our example of 5% per year, you divide the 5 into 70, you find that growing quantity will double in size every 14 years. You might ask, where did the 70 come from? The answer is, it’s approximately 100 multiplied by the natural logarithm of two. If you wanted the time to triple, you’d use the natural logarithm of three. It’s all very logical, but you don’t have to remember where it came from if you just remember 70.
I wish we could get every person to make this mental calculation every time we see a percent growth rate of anything in a news story. For example, if you saw a story that said things have been growing 7% per year for several recent years you wouldn’t bat an eyelash. But when you see a headline that says crime has doubled in a decade, you say, “My heavens, what’s happening?”. What is happening? 7% growth per year, divide the seven into 70, the doubling time is ten years. But notice, if you’re going to write a headline you never write, “Crime Growing 7% per Year”, because most people wouldn’t know what it really means.
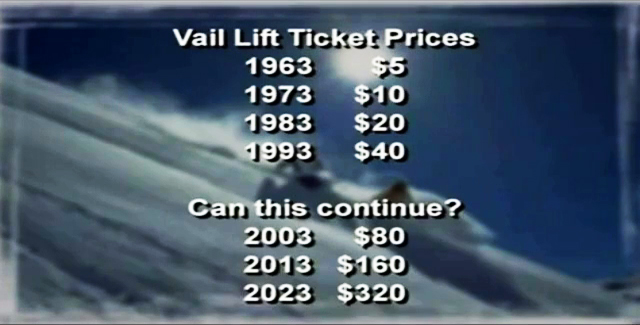
Do you know what 7% really means? Let’s take another example from Colorado. The cost of an all-day lift ticket to ski at Vail has been growing about 7% per year ever since Vail first opened in 1963. At that time you paid $5 for an all-day lift ticket. What’s the doubling time for 7% growth? Ten years. So what was the cost ten years later in 1973 ($10)? Ten years later in 1983 ($20)? Ten years later in 1993 ($40)? And what do we have to look forward to? This is what 7% means, most people don’t have a clue.
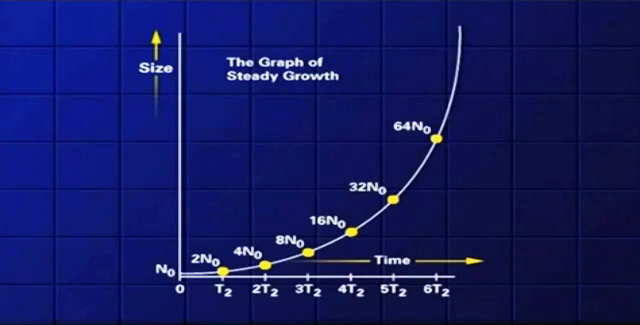
Let’s look at a generic graph of something that’s growing steadily. After one doubling time the growing quantity’s up to twice its initial size, two doubling times it’s up to four times its initial size. Then it goes to 8, 16, 32, 64, 128, 256, 512. In just ten doubling times it’s a thousand times larger than when it started. You can see, if you try to make a graph of that, an ordinary graph paper, the graph will go right through the ceiling.
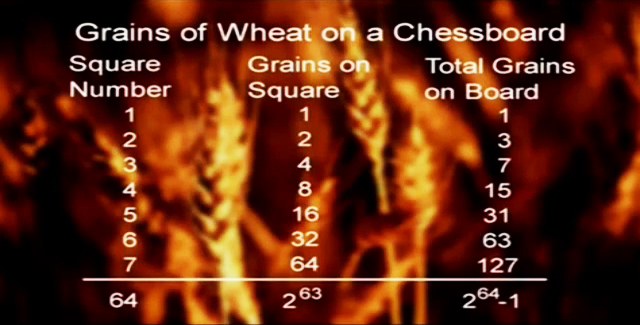
Let me give you an example to show the enormous numbers you get with just a modest number of doublings. Legend has it that the game of chess was invented by a mathematician who worked for a king. The king was very pleased, he said, “I want to reward you”. And the mathematician said, “My needs are modest, please take my new chess board, and on the first square place one grain of wheat, on the next square double the one to make two, on the next square double the two to make four, just keep doubling until you’ve doubled for every square, that will be an adequate payment”. We can guess the king thought, “This foolish man, I was ready to give him a real reward, all he asked for just a few grains of wheat”. Let’s see what’s involved in this. We note there are eight grains on the fourth square, I can get this number, eight, by multiplying three twos together, it’s 2x2x2, it’s one 2 less than the number of the square. That follows in each case, so on the last square I’d find the number of grains by multiplying 63 twos together. Let’s look at the way the totals build up. When we have one grain on the first square, the total on the board is one. We add two grains, that makes a total of three. We put on four grains, now the total is seven, seven is a grain less than eight, it’s a grain less than three twos multiplied together. Fifteen is a grain less than four twos multiplied together. That continues in each case, so when we’re done the total number of grains will be one grain less than the number I get multiplying 64 twos together. My question is, how much wheat is that? Would that be a nice pile here in the studio? Would have filled the building? Would it cover the county to a depth of two meters? How much wheat are we talking about? The answer is, it’s roughly 400 times the 1990 worldwide harvest of wheat. That could be more wheat than humans have harvested in the entire history of the earth. How do you get such a big number? It was simple, we just started with one grain, but we let the number grow steadily until it doubled a mere 63 times.
There’s something else that’s very important, the growth in any doubling time is greater than the total of all of the preceding growth. For example, when we put eight grains on the fourth square, the eight is larger than the total of seven that were already there. When we put 32 grains on the sixth square, the 32 is larger than the total of 31 there are already there. Every time the growing quantity doubles, it takes more than all that you’d used in all of the preceding growth. Let’s translate that into the energy crisis.

Here’s an ad from the year 1975 and had asked the question, “Could America run out of electricity?”. America depends on electricity, our need for electricity actually doubles every 10 or 12 years, that’s an accurate reflection of a very long history of steady growth of the electric industry in this country, growth at a rate of around 7% per year, which goes with doubling every 10 years. With all that history of growth, they just expected the growth would just go on forever. Fortunately it stopped, not because anyone understood the arithmetic, it stopped for other reasons, but let’s ask what if – suppose – the growth had continued? Then we would see here the thing that we just saw on the chessboard. In the ten years following the appearance of this ad, in that decade, the amount of electrical energy that we would have consumed in this country would have been greater than the total of all of the electrical energy we had ever consumed in the entire preceding history of the steady growth of that industry in this country.
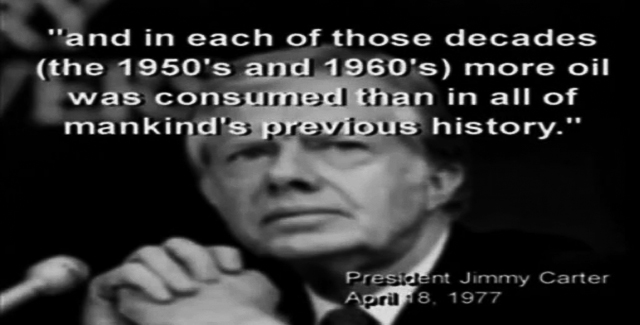
Did you realize that anything, as completely acceptable as 7% growth per year, could give such an incredible consequence? That in just 10 years you’d use more than the total of all that have been used in all of preceding history? That’s exactly what President Carter was referring to in his famous speech on energy. One of his statements was this, he said, “And in each of those decades (1950s and 1960s) more oil was consumed than in all of mankind’s previous history”. By itself, that’s a stunning statement, now you can understand it. The President was telling us a simple consequence of the arithmetic of 7% growth each year in world oil consumption, and that was the historic figure up until the 1970s.

Now there’s another beautiful consequence of this arithmetic. If you take 70 years as a period of time – and note that that’s roughly one human lifetime – then any percent growth continued steadily for 70 years gives you an overall increase by a factor, that’s very easy to calculate. For example, 4% per year, you find the factor by multiplying four twos together, it’s a factor of 16. A few years ago, one of the newspapers here in Boulder quizzed the nine members of the Boulder City Council, and asked them, “What rate of growth of Boulder’s population do you think it would be good to have in the coming years?”. The nine members of the Boulder City Council gave answers ranging from a low of 1% per year. That happens to match the present rate of growth of the population of the United States, we are not at zero population growth, right now the number of Americans is increasing by more than three million people every year. No member of the city Council said Boulder should grow less rapidly than the United States is growing, the highest answer any council member gave was 5% per year. I felt compelled, I had to write him a letter and say, “Did you know that 5% growth for just 70 years” – I can remember when 70 years used to seem like an awful long time, it doesn’t seem so long now – “that means Boulder’s population would increase by a factor of 32?”. That is, where today we have one overloaded sewer treatment plant, in 70 years we need 32 overloaded sewer treatment plants. Did you realize that anything as completely all-American as 5% growth per year could give such an incredible consequence in such a modest period of time? Our city council people had zero understanding of this very simple arithmetic.
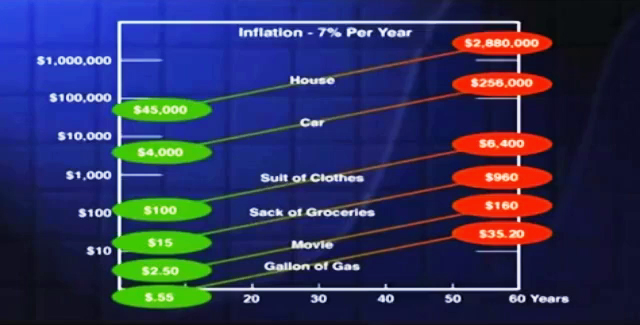
A few years ago I had a class of non-science students that were interested in problems of science and society. We spent a good deal of time learning to use semi-logarithmic graph paper, it’s printed in such a way that these equal intervals along the vertical scale, each represent an increase by a factor of 10. So you go from one thousand, to ten thousand, to a hundred thousand, the reason to use this special paper is that on this paper a straight line represents steady growth. We worked a lot of examples, I said to the students, “Let’s talk about inflation, let’s talk about 7% per year”. It wasn’t this high when we did this, it’s been higher since then, fortunately it’s lower now. I said to the students, as I can say to you, you have roughly 60 years life expectancy ahead of you. Let’s see what some common things will cost if we have 60 years of 7% annual inflation. The students found that a $0.55 gallon of gasoline will cost $35.20, $2.50 for a movie will be $160, the $15 sack of groceries – that my mother used to buy for $1.25 – that will be $960, $100 dollars suit of clothes $6400, a $4000 automobile will cost a quarter of a million dollars, a $45000 home will cost nearly 3 million dollars.
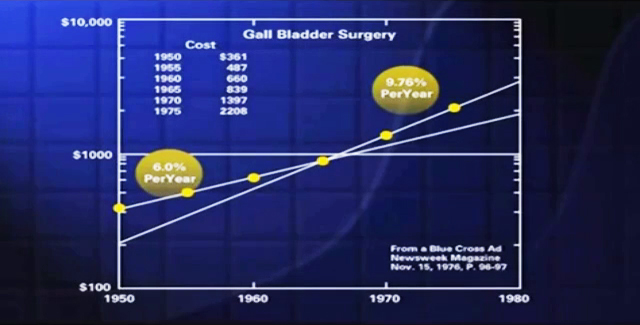
I gave the students these data, these came from a Blue Cross, Blue Shield ad, the ad appeared in Newsweek magazine, and the ad gave these figures to show the cost escalation of gall bladder surgery, in the years since 1950, when that surgery cost $361. I said, “Make a semi logarithmic plot, let’s see what’s happening”. The students found that the first four points lined up on a straight line whose slope indicated an inflation of about 6% per year. But the fourth, fifth and sixth were on a steeper line, almost 10% inflation per year. Then I said to the students, “Run that steeper line on, out to the year 2000, let’s get an idea what gall bladder surgery might cost”. The answer is $25000, the lesson there is awfully clear, if you’re thinking about gall bladder surgery, do it now.
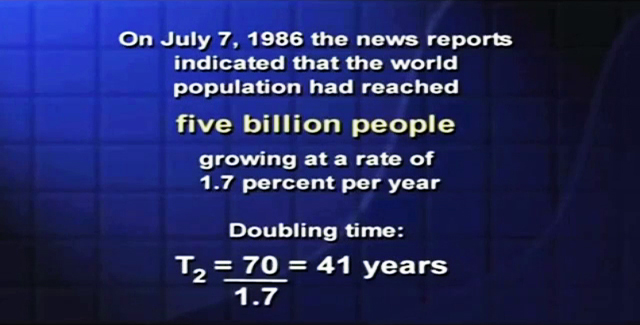
In the summer of 1986, the news reports indicated that the world population had reached the number five billion people growing at the rate of 1.7% per year. Your reaction to 1.7% might be to say, “That’s so small, nothing bad could ever happen at 1.7% per year”. You calculate the doubling time, you find it’s only 41 years. More recently, in 1999, we read that the world population had increased from five billion to six billion people. The good news is that the growth rate had dropped from 1.7% per year to 1.3% per year. The bad news is that, in spite of the drop in the growth rate, the world population today is increasing by something over 80 million people every year.
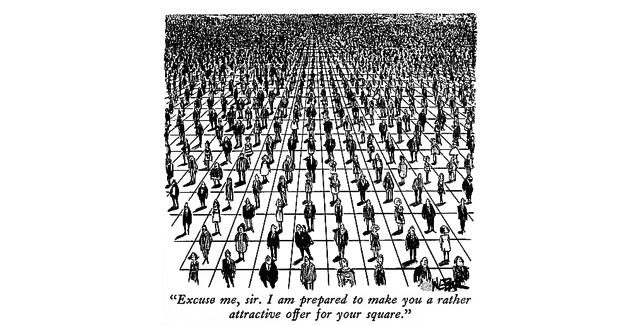
If this modest current 1.3% per year could continue, the world population would grow to a density of one person per square meter on the dry land surface of the earth in just 780 years, and the mass of people would equal the mass of the earth in just 2400 years. We can smile at those, we know they couldn’t happen. This one makes for a cute cartoon, the caption says, “Excuse me sir, but I am prepared to make you a rather attractive offer for your square”. There’s a very profound lesson in that cartoon, the lesson is that zero population growth is going to happen. We can debate whether we like zero population growth, or don’t like it, it’s going to happen whether we debate it or not, whether we like it or not, it’s absolutely certain people could not live at that density on the dry land surface of the earth. Therefore, today’s high birth rates will drop, today’s low death rates will rise, until they have exactly the same numerical value. That will certainly be in a time short compared to 780 years.
So maybe you’re wondering what sort of options are available if we wanted to address the problem. In the left hand column, I’ve listed some of those things that we should encourage if we want to raise the rate of growth of population, and in so doing make the problem worse. Just look at the list, everything in the list is as sacred as motherhood, there’s immigration, medicine, public health, sanitation. These are all devoted to the humane goals of lowering the death rate, and that’s very important to me, if it’s my death they’re lowering. But then I have to realize that anything that just lowers the death rate makes the population problem worse. There’s peace, law and order. Scientific agriculture has lowered the death rate due to famine, that just makes the population problem worse. The 55 mile an hour speed limit saved thousands of lives, that makes the population problem worse. Clean air makes it worse. In this column are some of the things we should encourage if we want to lower the rate of growth of population, and in so doing help solve the population problem. There’s abstention, contraception, abortion, small families, stop immigration, disease, war, murder, famine, accidents. Smoking clearly raises the death rate, that helps solve the problem.
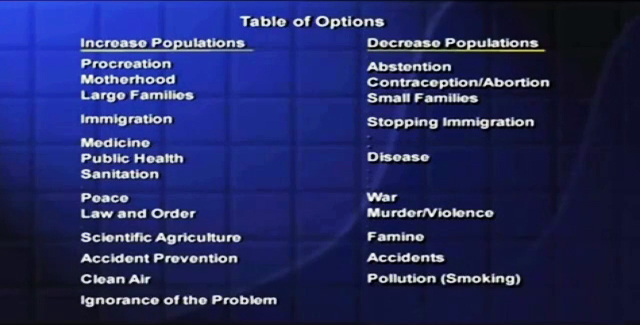
Remember our conclusion from the cartoon of one person per square meter, we concluded that zero population growth is going to happen. Let’s state that conclusion in other terms and say it’s obvious nature is going to choose from the right hand list, and we don’t have to do anything except be prepared to live with whatever nature chooses from that right hand list. Or we can exercise the one option that’s open to us, that option is to choose first from the right hand list, we’ve got to find something here we can go out and campaign for. Anyone here for promoting disease? We now have the capability of incredible war, would you like more murder, more famine, more accidents? Here we can see the human dilemma, because everything we regard as good makes the population problem worse, everything we regard as bad helps solve the problem. There is a dilemma if ever there was one. The one remaining question is education. Does it go on the left hand column or the right hand column? I’d have to say thus far it’s been firmly in the left hand column, it hasn’t done much about reducing ignorance of the problem.
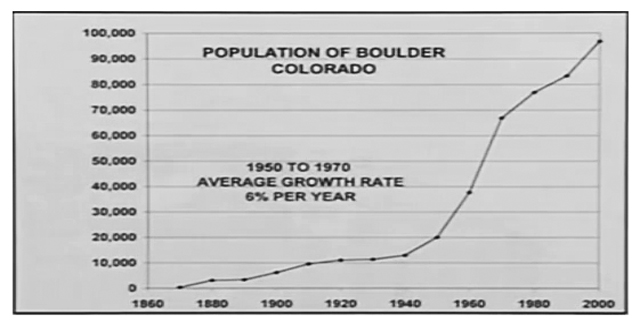
Nature is already choosing from that right hand list, you’ve read about the AIDS epidemic that’s devastating the continent of Africa. I had a friend back from Zimbabwe, “People”, he said, “are dying on the streets”. Nature is taking care of the problem. So where do we start? Let’s start in Boulder, Colorado. Here’s a graph of Boulder’s population, there’s the 1950 US Census figure, 1960, 1970. In that twenty year period the average growth rate of Boulder’s population was about 6% per year, we’ve been able to slow the growth somewhat, there’s a 2000 census figure. I like to ask people, let’s start with that 2000 census figure, go another 70 years – one more human lifetime – and ask what rate of growth of Boulder’s population would we need in that 70 years, so that at the end of 70 years Boulder’s population would equal today’s population of your choice of major American cities?
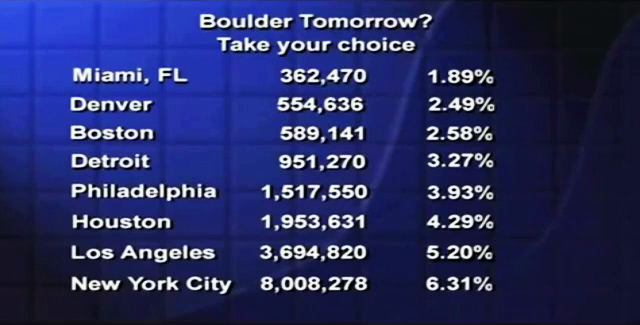
Boulder in 70 years could be as big as Boston is today, if we just grew 2.58% per year. If we thought Detroit was a better model, we’ll have to shoot for 3.27% per year. Remember the historic figure on the preceding slide, 6% per year? If that could continue for one lifetime, Boulder would be larger than Los Angeles. This isn’t Boulder plus Broomfield, Lewisville, Lafayette, the other towns in the county, this is just Boulder. It’s obvious you couldn’t put Los Angeles in the Boulder Valley, therefore it’s obvious Boulder’s population growth is going to stop. The only question is, will we be able to stop it while there’s still some open space, or will we wait until it’s wall-to-wall people, and we’re all choking to death?
It’s interesting to read what the boosters say. Some years ago we read that doubling its population in 10 years Boulder is indeed a stable community. What in the world are they talking about? You’re going 100 miles an hour, 7% growth per year, doubling in less than 10 years, and someone make the idiotic statement that we’re stable, we’re standing still, we’re not moving? They don’t even understand the meaning of the words that they put down on paper. Every once a while somebody says, “But you know, a bigger city might be a better city”, and I have to say, “Wait a minute, we’ve already done that experiment!”. We don’t need to wonder what will be the effect of growth on Boulder, because Boulder tomorrow can be seen in Los Angeles today, for the price of an airplane ticket, we can step 70 years into the future, and see exactly what it’s like. What is it like? There’s an interesting headline from Los Angeles, “Levels of Carcinogens in air are 426 times the federal standard”. That headline probably has something to do with this headline, “Smog kills 1600 annually in LA area”.
How are we doing in Colorado? The Denver Post tells us that we’re the growth capital of the USA and proud of it. The Rocky Mountain News tells us to expect another million people in the Front Range in the next 20 years. In the Denver Post there was an interesting story, someone was quoted as saying Colorado has a 3% growth rate, that’s like a third world country with no birth control. We send foreign aid, family planning assistance to countries that have smaller population growth rates than Colorado has. As you can imagine, growth control is very controversial, and I treasure the letter from which these quotations are taken. This letter was written to me by a leading citizen of this community, he’s a leading proponent of “Controlled growth”. “Controlled growth” just means “Growth”. This man writes, “I take no exception to your arguments regarding exponential growth, […] I don’t believe the exponential argument is valid at the local level”. You see arithmetic doesn’t hold in Boulder. I have to admit, that man has a degree from the University of Colorado, it’s not a degree in mathematics, in science or in engineering.

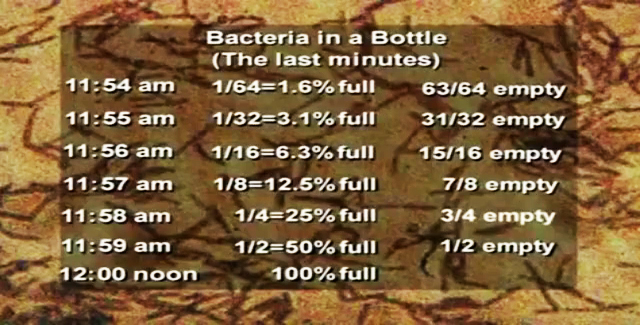
Let’s look now at what happens when we have this kind of steady growth in a finite environment. Bacteria grow by doubling, one bacterium divides to become two, the two divide to become 4, the four become 8, 16 and so on. Suppose we have bacteria that doubled in number this way every minute, suppose we put one of these bacteria in an empty bottle at 11:00, and then observe that the bottle is full at 12:00. There’s our case of just ordinary steady growth, it has a doubling time of one minute, it’s in the finite environment of one bottle. I want to ask you three questions.
(1) At what time was the bottle half full? Would you believe 11:59, one minute before 12:00? Because they double in number every minute.
(2) If you were an average bacterium in that bottle, at what time would you first realize that you were running out of space? Think about this, this kind of steady growth is the centerpiece of the national economy, and of the entire global economy, think about it. Let’s just look at the last minutes in the bottle. At 12:00 it’s full, one minute before it’s half full, 2 minutes before it’s a quarter full, then a 1/8th, then a 1/16th. Let me ask you, at five minutes before 12:00, when the bottle is only 3% full and is 97% open space, just yearning for development, how many of you would realize there’s a problem?
In the ongoing controversy over growth in Boulder, someone wrote to the newspaper some years ago and said, “Look, there isn’t any problem with population growth in Boulder”, the writer said, “because we have fifteen times as much open space as we’ve already used”. Let me ask you what time was it in Boulder when the open space was fifteen times the amount of space we’d already used? The answer is, it was four minutes before 12:00 in Boulder Valley. Suppose that at 2 minutes before 12:00 some of the bacteria realize that they’re running out of space, they launch a great search for new bottles, they search offshore on the outer continental shelf, and in the overthrust belt, and in the Arctic, and they find three new bottles. That is a colossal discovery, that discovery is three times the amount of resource they ever knew about before. They now have four bottles, before the discovery there was only one. Surely this will give them a sustainable society, won’t it?

(3) How long can the growth continue as a result of this magnificent discovery? Let’s look at the score at 12:00, one bottle is filled, there are three to go. 12:01 two bottles are filled, there are two to go. At 12:02 all four are filled and that’s the end of the line. You don’t need any more arithmetic than this to evaluate the absolutely contradictory statements we’ve all heard and read from experts, who tell us in one breath we can go on increasing our rates of consumption of fossil fuels, in the next breath they say, “But don’t worry, we’ll always be able to make the discoveries of new resources that we need to meet the requirements of that growth”.
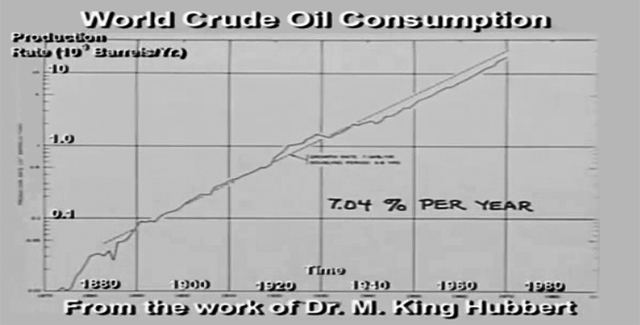
Some years ago in Washington, our Energy Secretary observed that in the energy crisis, “We have a classic case of exponential growth against a finite source”. Let’s look at some of these finite sources. From the work of the late Dr. M. King Hubbert, we have here his semi-logarithmic plot of world oil production. The line has been approximately straight for over 100 years, clear up here to the year 1970, average growth rate very close to 7% per year. It’s logical to ask, how much longer could that 7% continue? That’s answered by the numbers in this table, in the top line the numbers tell us that in the year 1973 world oil production was 20 billion barrels. The total production in all of history, including that 20, was 300 billion, the remaining reserves 1700 billion. Those are data, the rest of this table is just calculated out, assuming that the historic 7% growth continued steadily each year following 1973, exactly as it had been for the preceding 100 years. In fact the growth stopped, not because of the arithmetic, it stopped because OPEC raised their oil prices.
We’re asking, what if? Suppose the growth had continued. Let’s go back to the year 1981, by 1981 on the 7% curve the total usage in all of history would add up to 500 billion barrels, the remaining reserves 1500 billion. The reserves, at that point, are three times the total of all that have been used in all of history. That’s an enormous reserve, but what time is it when the remaining reserve is three times the total of all you’ve used in all of history? The answer is two minutes before 12:00. We know for 7% growth, the doubling time is 10 years. We go from 1981 to 1991, by 1991 on the 7% curve the total usage in all of history would add up to 1000 billion barrels, there would be 1000 billion left. At that point, the remaining oil would be equal in quantity to the total of all that we had used in something like 130 years of the oil industry on this earth. By most measures you’d say, “That is an enormous remaining reserve”. But what time is it when the remaining reserve is equal to all that you’ve used in all of history? The answer is, it’s one minute before 12:00. We go one more decade to the turn of the century – that’s like right now – that’s when 7% would finish using up the oil reserves of the earth.
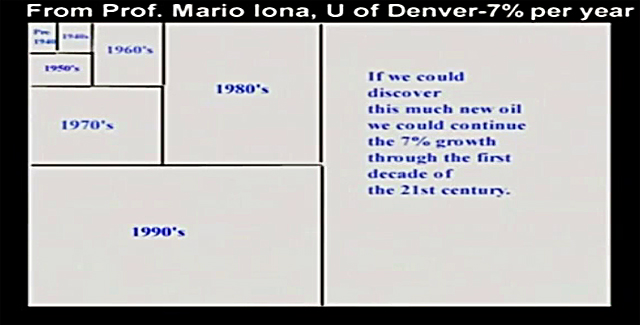
Let’s look at this in a very nice graphical way. Suppose the area of this tiny rectangle represents all the oil we used on this earth before 1940. Then in the decade of the 40s we used this much, that’s equal to the total of all that have been used in all of history. In the decade of the 50s we used this much, that’s equal to the total of all that have been used in all of history. In the decade of the 60s we used this much, and again that’s equal to the total of all the preceding usage. Here we see graphically what President Carter told us, if that 7% had continued through the 70s, 80s and 90s, there’s what we need, but that’s all the oil there is. There’s a widely held belief that if you throw enough money at holes in the ground, oil is sure to come up. There will be discoveries in new oil, there may be major discoveries, but look, we have to discover this much new oil if we would have that 7% growth continue 10 more years. Ask yourself, what do you think is the chance that oil discovered after the close of our class today will be in an amount equal to the total of all that we’ve known about in all of history? Then realize if all that new oil could be found, that would be sufficient to let the historic 7% growth continue 10 more years.
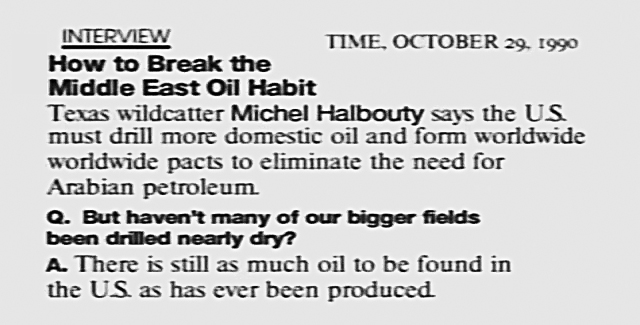
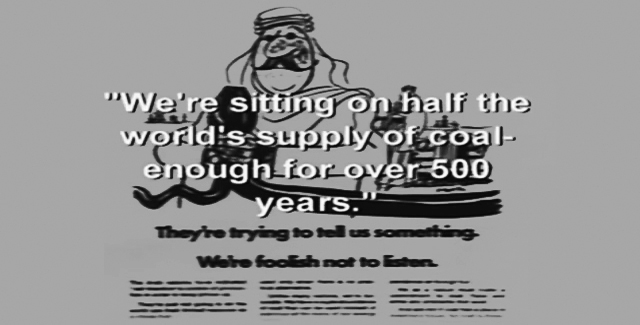
It’s interesting to read what the experts say. Here’s an interview in Time magazine, with one of the most widely quoted oil experts in all of Texas, they asked him, “But haven’t many of our bigger fields been drilled nearly dry?”. He responds saying, “There’s still as much oil to be found in the USA as has ever been produced”. Let’s assume he’s right. What time is it? The answer is, it’s one minute before 12:00. I’ve read several things this guy has written, I don’t think he has any understanding of this very simple arithmetic. In the crisis back in the seventies ads such as this appeared, this is from the American Electric Power Company. It is a bit reassuring, sort of saying now don’t worry too much, “Because we’re sitting on half of the world’s known supply of coal, enough for over 500 years”. Where did that “500 year” figure come from? It may have had its origin in this report to the committee on interior and insular Affairs of the US Senate, because in that report we find this sentence, “At current levels of output and recovery, these American coal reserves can be expected to last more than 500 years”. There is one of the most dangerous statements in the literature.
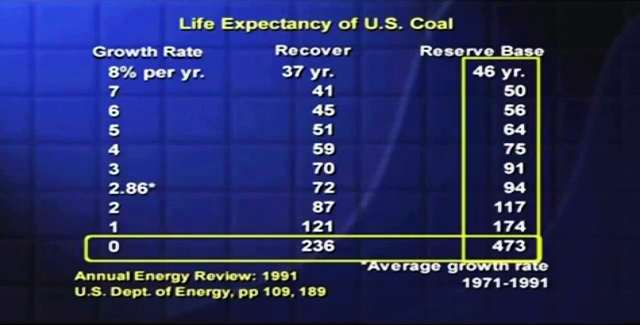
It’s dangerous because it’s true, but it isn’t the truth that makes it dangerous, the danger lies in the fact that people take the sentence apart, they just say coal will last 500 years. They forget the caveat with which the sentence started. What were those opening words? “At current levels”. What does that mean? It means if – and only if – we maintain zero growth of coal production in this country. Let’s look at a few numbers. We go to the Annual Energy Review published by the US Department of Energy, they give this figure as the coal demonstrated reserve base (57 billion tons), it carries a footnote that says, “About half the demonstrated reserve base is estimated to be recoverable”. You cannot recover and use 100% of the coal that’s in the ground, this number (24 billion tons) is half of this number, and we’ll come back to those in just a moment. The report also tells us that in the year 1971 we were mining coal in this country at this rate (0.56 billion tons), twenty years later in 1991 we were mining at this rate (0.99 billion tons). Put those numbers together, the average growth rate of coal production in those twenty years was 2.86% per year. We have to ask, how long could a resource last if you had steady growth in the rate of consumption until the last bit of it was used?
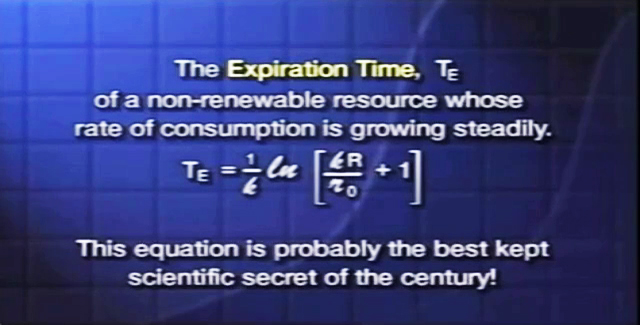
I’ll just show you that equation for the expiration time, I’ll tell you it takes first year college calculus to derive that equation, it can’t be very difficult, I have the feeling there must be dozens of people in this country have had first year college calculus. But let me suggest, I think that equation is probably the best kept scientific secret of the century, let me show you why. If you use that equation to calculate the life expectancy of the reserve base, or of the one half the reserve base that’s estimated to be recoverable, for different steady rates of growth, you find if the growth rate is zero, the small estimate would go about 240 years, the large one would go close to 500 years. That report to the Congress was correct, but look what we get when we plug in steady growth. Back in the 1970s, we had national goal of achieving 8% per year growth rate in coal production in the USA, if that could be achieved and continued coal will last between 37 and 46 years. President Carter cut that goal roughly in half, hoping to reach 4% per year, if that could continue, coal will last between 59 and 75 years. Here’s that 2.86% that we just saw the average for a recent twenty years period, if that could continue, coal would run out between 72 and 94 years. That’s within the life expectancy of children born today.
The only way we’re going to get anywhere near this widely quoted 500 year figure is to do simultaneously two highly improbable things.
(1) We’ve got to figure out how to use 100% of the coal that’s in the ground.
(2) We’ve got to figure out how to have 500 years of zero growth of coal production.
These are simple facts, just look at those numbers. I got a report recently from the coalfields of Kentucky, West Virginia, Virginia, these giant bituminous coal fields that supply a large fraction of the electricity in the eastern USA. They estimate that maybe they have another 30 years of coal mining, before it will become uneconomical to mine there. Then what will we do when we want to switch on the lights?